SMU Academy | DASR | A First Look at Visual Analytics using ggplot2 | 2023 Cohort 1
Group Assignment Questions 1 through 3
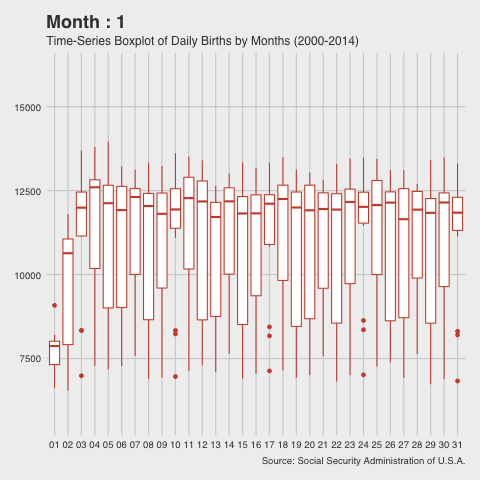
The following three figures are created based on the dataset births_2000_2014_SSA_USA.csv that contains U.S. births data for the years 2000 to 2014, as provided by the Social Security Administration.

Question 1
Question 2

Question3